
One of the most common problems I hear from data scientists is that it’s incredibly difficult to make a statistical model useful to an entire organization. Oftentimes, a skilled data scientist will build an awesome model and do some amazing analysis, only to have it wind up in some Power Point presentation that gets forgotten about two days later. That is a crying shame, and I don’t like imagining the number of missed business opportunities this must represent in our economy. I find it ironic that despite all of the amazing advances made to open source scalable technology like Spark and Hadoop, the insights gained from such technology don’t typically scale across an enterprise.
In my last post, I shared a method for doing cluster analysis on Adobe Analytics’ Data Feeds. While there were some really cool insights, the actionability of those results was not great. To make the results more actionable I could construct a Shiny dashboard to share the results, but most analysts want to see insights in the tools they already use. Unless I have a way to share the results of my R modeling back into Adobe Analytics, it would be foolish of me to expect very many analysts or data consumers to use the results of my clustering in their day to day reporting or marketing strategies.
In this post, I’m going to show you how you can actually take the results from a clustering model (or any other visitor classification or propensity model) and put it back into Adobe Analytics in a way that it can be used natively by analysts using a feature called Customer Attributes.
To start, I’m going to rely on what I call a “visitor rollup” table (you can read how to build one of those here) that has each unique visitor id from the Data Feed as one column, and the output of my cluster model in another column. In my case, I’ve merged the post_visid_high and post_visid_low into a single field called “visitor_id” which is just a sparlyr mutated field where I’ve taken the high and low values and concatenated them using “_” in the middle. In other words, I need a table that looks something like this:
| aaid | cluster_assignments |
|---|---|
| 2962692404634795947_4611710224329275137 | 3 |
| 2962696628736409558_6917530638254247480 | 2 |
| 2962697288012595360_4611687136194751188 | 3 |
| 2962699246517697116_4611710229697234452 | 1 |
An important thing to call out here is that the Data Feed has given me almost what I need to import the cluster assignments as a customer attribute. The tricky thing we’re going to do next is convert those enormous integer values into hexadecimal because the Analytics cookie ID (which is what Customer Attributes needs to do its thing) is stored in hex even though the data feed keeps those values as integers. To do this, I’m going to rely on a couple R packages that make life easier:
library(Rmpfr)
library(parallel)
The first library “Rmpfr” is a great library for converting arbitrarily large numbers from one format to another. Integers as large as what exist in Data Feeds’ visitor ID columns won’t fit into the standard numeric variables R uses. Here’s how I convert my table of visitor IDs into hexadecimal using the parallel library (which is an awesome way to unlock all the cores on your machine) to speed things up:
# Convert the integer visitor IDs to hex visitor IDs
convert_to_hex = function(visitor_id){
 visid_hi = toupper(as.character(
     formatMpfr(mpfr(strsplit(visitor_id,"_")[[1]][1], base=10),
                base=16,
                drop0trailing=TRUE)))
 visid_lo = toupper(as.character(
     formatMpfr(mpfr(strsplit(visitor_id,"_")[[1]][2], base=10),
                base=16,
                drop0trailing=TRUE)))
 visitor_id_hex = paste0(visid_hi,"-",visid_lo)
 return(visitor_id_hex)
}

# Use the parLapply (instead of lapply) to more quickly convert the IDs
# I use all but one core so I don't completely kill my machine
n_cores = detectCores() - 1

# Using the FORK option means I can use all the R libraries I've installed
cl = makeCluster(n_cores, type="FORK")

# Make the conversion and stop the cluster to free up the cores again
hex_visitor_ids = parLapply(cl, local_visitor_rollup$visitor_id, convert_to_hex)
stopCluster(cl)

# Convert the data back into a useable data frame
hex_visitor_ids = as.data.frame(unlist(hex_visitor_ids))

# Combine converted hex IDs with cluster assignments
# Note: cluster_assignments came from my previous post
cluster_mapping = data.frame(hex_visitor_ids, cluster_assignments)
Notice that in my convert_to_hex function I’m splitting the IDs, converting them to hex, then combining them back again using a dash instead of an underscore to match the cookie values. Here’s what the data looks like after the conversion:
| aaid | cluster_assignments |
|---|---|
| 291D990B85013FAB-40001603E02EF701 | 3 |
| 291D9CE30514BFD6-6000017700068E38 | 2 |
| 291D9D7C850100A0-4000010440206AD4 | 3 |
| 291D9F4485013A5C-4000160520238614 | 1 |
Next, I need to create a CSV file that I can upload to the Customer Attributes UI to classify the visitors I’ve analyzed:
# Create file to upload to Customer Attributes UI
write.table(cluster_mapping,
            file="cluster_mapping.csv",
            sep=",", row.names = FALSE)
To upload the files, just follow the instructions here if you’ve never done it before. Your organization needs to be provisioned for the Marketing Cloud, and you’ll need an Adobe ID. If you don’t have (or don’t know) your Marketing Cloud Org ID, you’ll need to call Adobe’s Customer Care to get that setup. If you need a login, you’ll have to contact the Marketing Cloud admin at your own company.
Once you’re in, here’s how you’ll navigate to the right place:
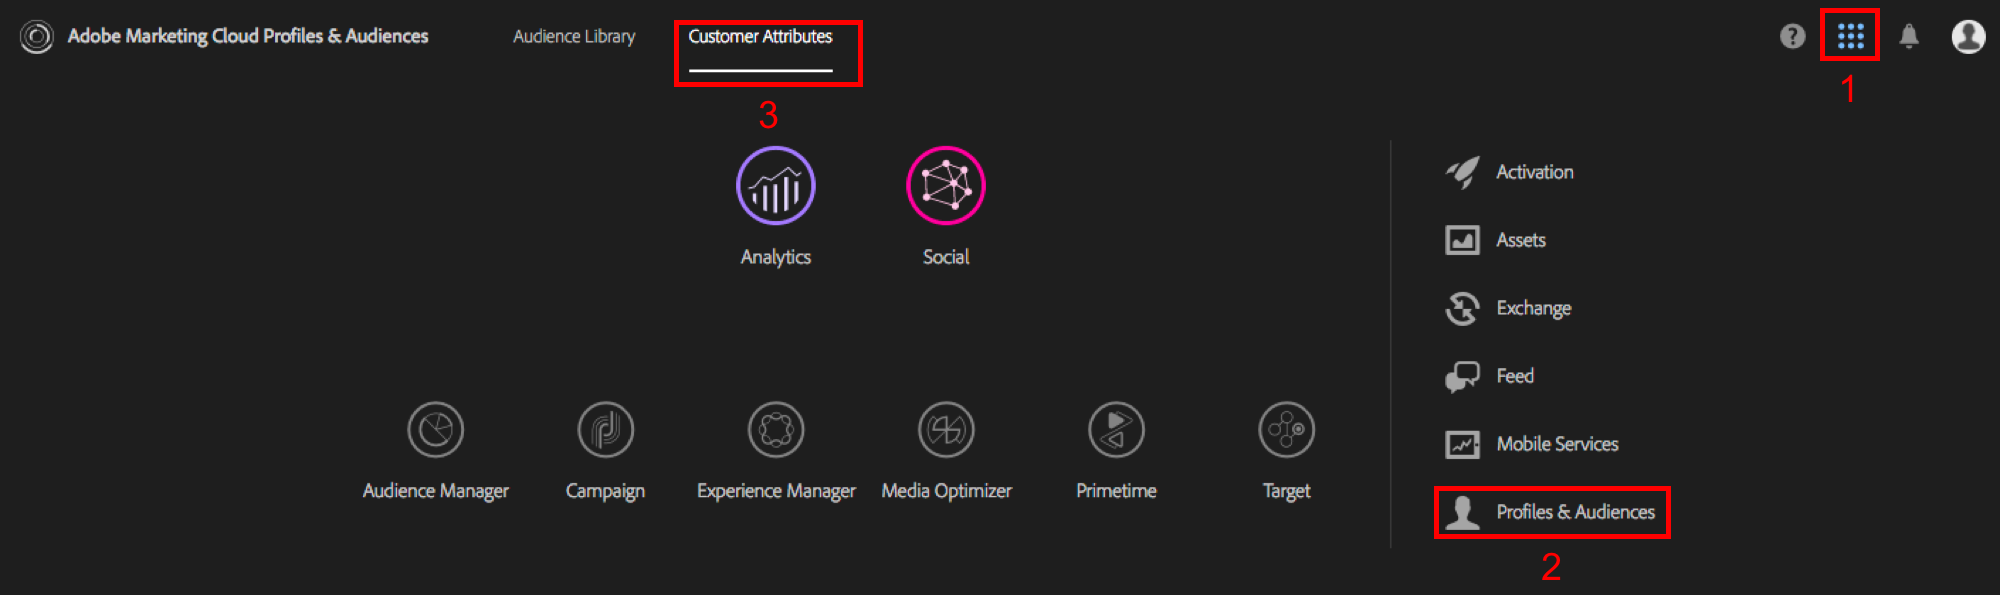
Then, just click to add a new Customer Attribute at the top. From there, you’ll give your Customer Attribute a name and description:
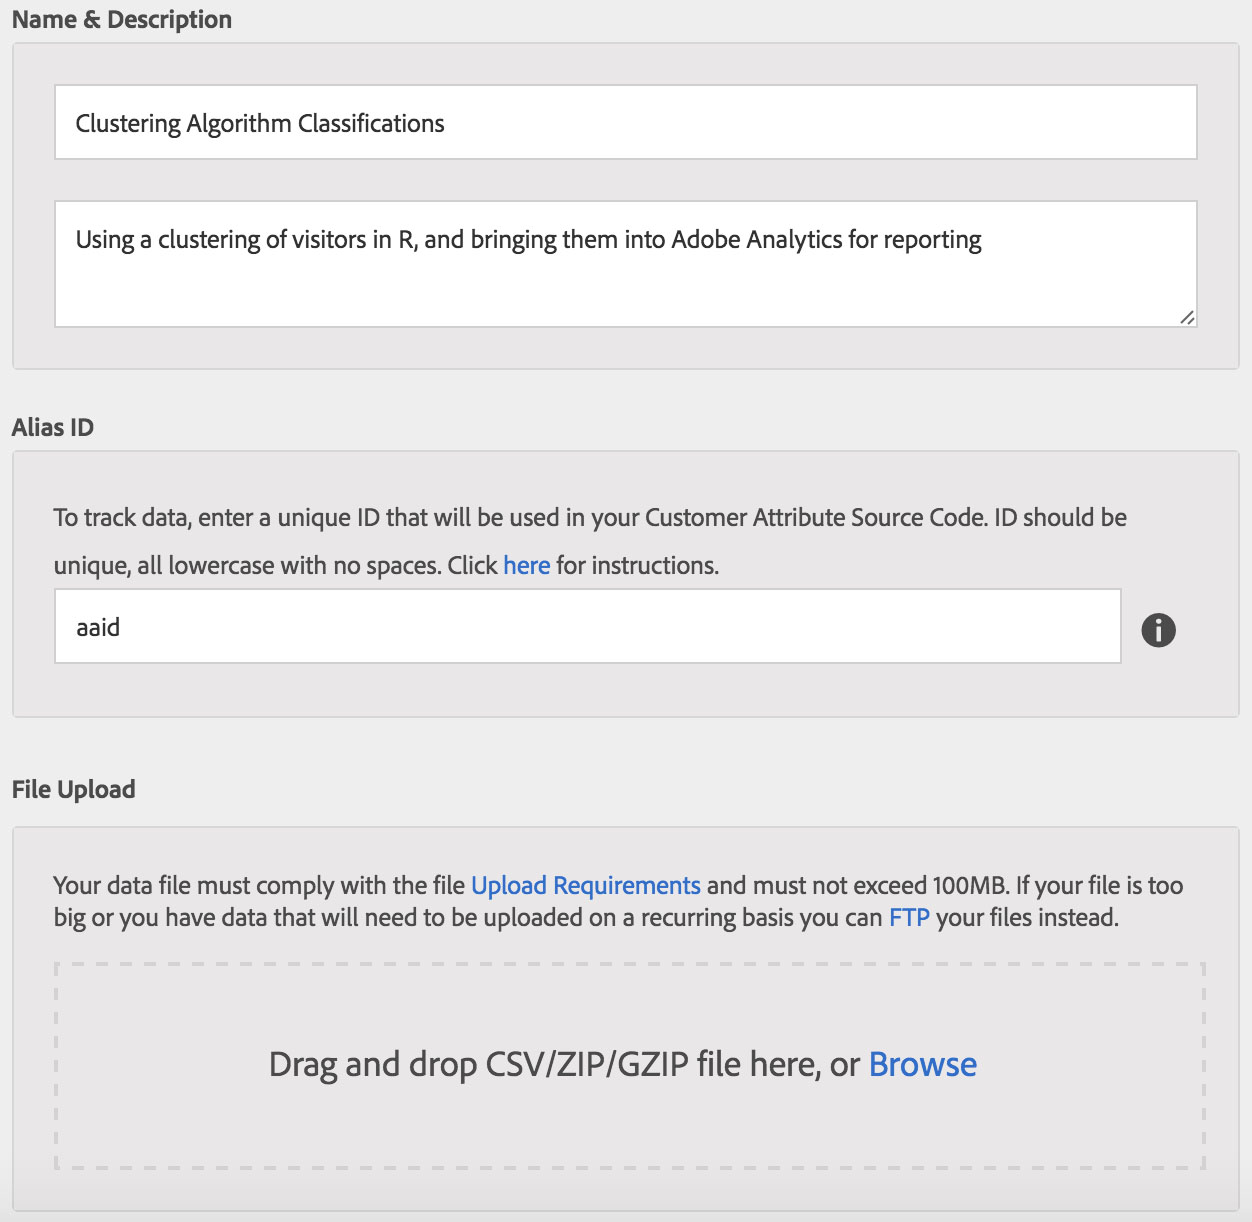
Important: the “Alias ID” needs to match the column header of the hexadecimal column we created in our CSV file previously (in this case I’ve named it “aaid”). Also, if you’ve deployed the Marketing Cloud ID Service, you should use the “mcvisid” Data Feed column as your Alias ID instead of the post visitor ID high and low fields as I described above. The “mcvisid” field you can take as-is without converting to hexadecimal which is convenient.
Now just upload the CSV file right into the interface. It should find your “cluster_assignments” column as an attribute you can use and it’ll ask you to validate the schema. I just set “cluster_assignments” as a text field, but you can set it as a numeric field if you want to upload a propensity score or other numeric attribute outside of the clustering use case I’m showing here.
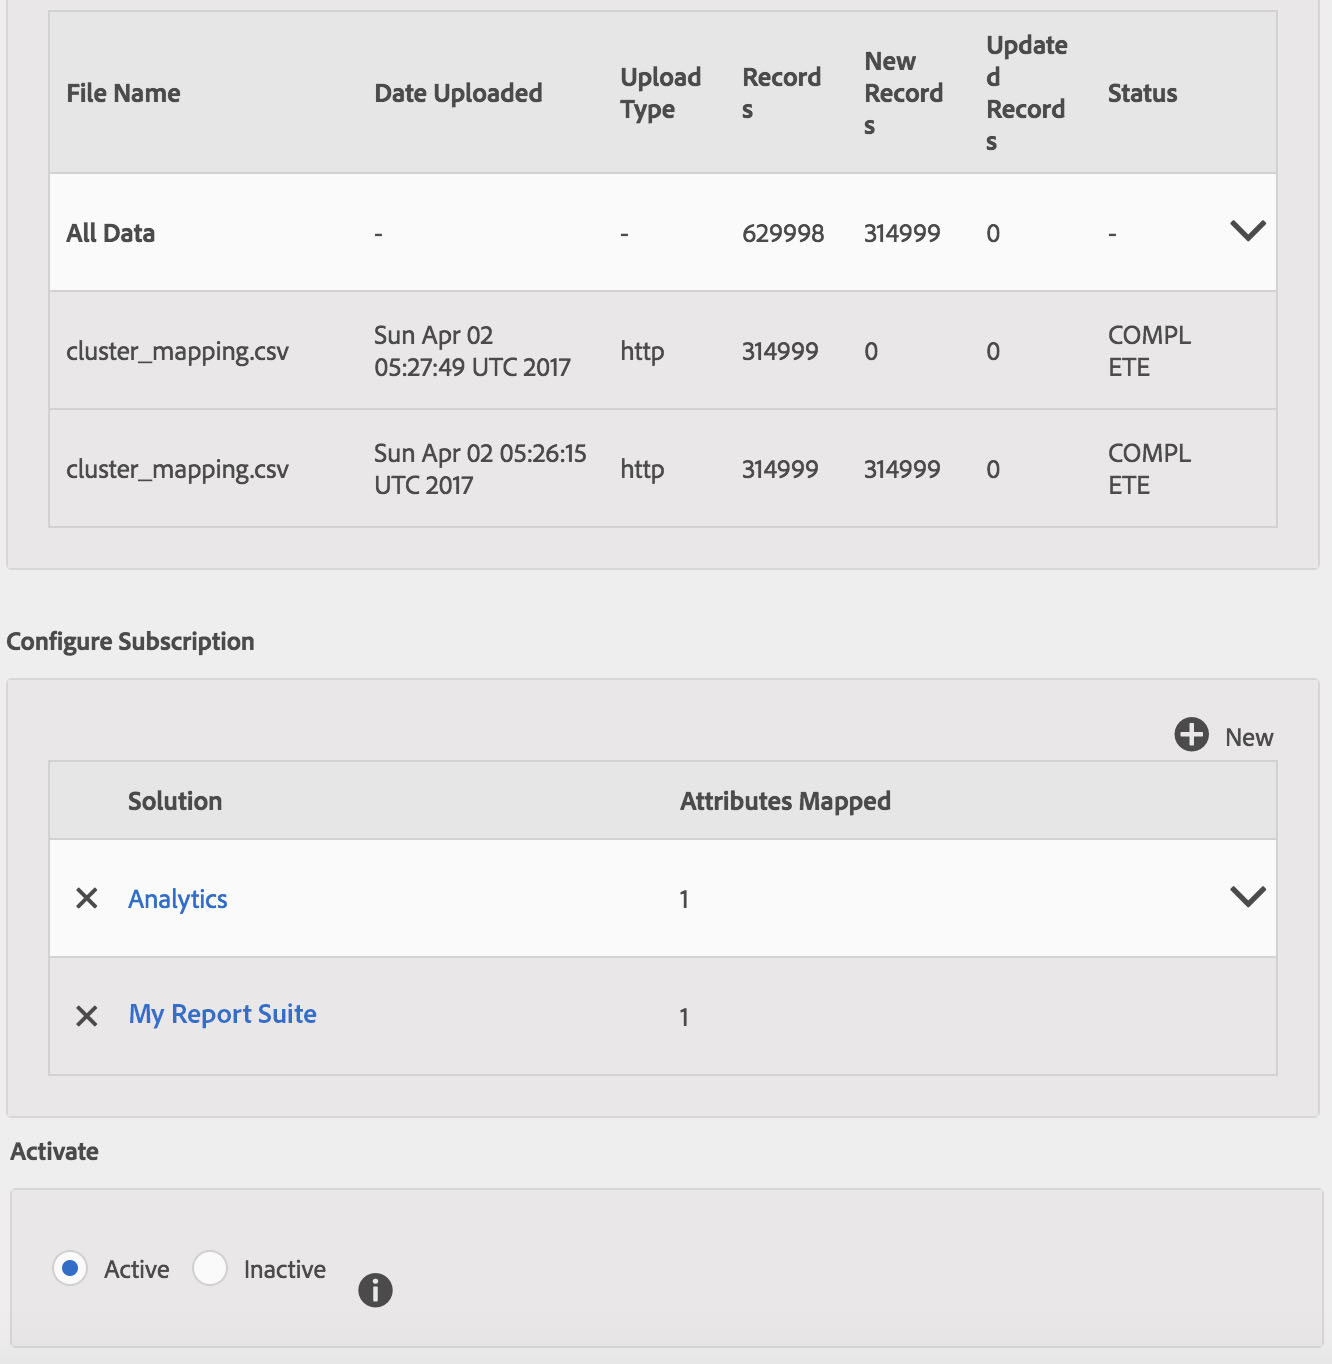
Once you’ve uploaded your file, you’ll need to activate your Customer Attributes subscription as per the instructions and you should wind up with something like this (I accidentally uploaded the CSV file twice, which is no big deal):
Now that I’ve got my file uploaded, there is only one thing left: syncing the alias ID with the actual visitors in my data. There are two ways to accomplish this:
-
- Have your developers update your JavaScript implementation to set visitor.setCustomerIDs using the alias ID “aaid” (or whatever alias you want to use) and set it to the Marketing Cloud ID itself. The JavaScript call looks like this:
// Setting customer ID to the Analytics ID
visitor.setCustomerIDs({"aaid": visitor.getAnalyticsVisitorID()});

// Or Setting customer ID to the MCID
visitor.setCustomerIDs({"aaid": visitor.getMarketingCloudVisitorID()});
This is the easiest way to do it (and the way I would recommend) since all of the ID syncing will happen automatically on the site and you can simply upload the CSV file and everything will work without any extra steps.
- The second way takes slightly longer, but it works even if you haven’t setup your site to make the setCustomerIDs call and you don’t have to make any modifications to your site. In fact, it works even if you haven’t setup the Marketing Cloud ID Service. To make this work, you just have to spoof the setCustomerIDs call from R:
# Parallel setCustomerID a bunch of times
library(RCurl)
responses = mclapply(cluster_mapping$aaid, function(aaid, mcid){
 org_id = "YOURORGIDGOESHERE@AdobeOrg"
 url = paste0("https://dpm.demdex.net/id?",
              "d_visid_ver=1.8.0&",
              "d_fieldgroup=AAM&",
              "d_rtbd=json&",
              "d_ver=2&",
              "d_orgid=", org_id, "&",
              "d_nsid=0&",
              ifelse(missing(mcid),"", paste0("d_mid=", mcid, "&")),
              "d_blob=NRX38WO0n5BH8Th-nqAG_A&",
              "d_cid_ic=AVID%01", aaid, "&",
              "d_cid_ic=aaid%01", aaid, "&",
              "ts=1491014875614"
        )
 response = getURL(url = url,
                   ssl.verifyhost = FALSE,
                   ssl.verifypeer = FALSE,
                   followlocation = TRUE)
 return(response)
}, mc.cores=7)
This approach basically fires a spoofed setCustomerIDs request for every single ID in your list (which if you followed my previous guide is every single visitor in your dataset). Notice the query string param I’m setting in this function, “d_cid_ic”. This is the query string param Customer Attributes will look for to find a match against the file I’ve uploaded. If you have an MCID from the “mcvisid” Data Feed field, you’ll want to supply that as the second parameter to the R function above.
Even with a parallelized multi-threaded approach, this could take a few days if you have millions of visitors and might be unfeasible if you have more than that. If you have more serious network and computing resources at your disposal, you can probably make all of those API calls in a faster time frame, but that’s outside the scope of my post.
The bright side is you only have to do it once (even if you upload new columns against the same visitors), and so long as you can get the first approach above up and running at some point, this second approach can be used to backfill any historical visitors your site doesn’t get automatically. The other good thing is that Adobe doesn’t charge any extra for setCustomerIDs requests, so you can do this without worrying you’ll inflate the server calls in your Adobe Analytics bill.
- Have your developers update your JavaScript implementation to set visitor.setCustomerIDs using the alias ID “aaid” (or whatever alias you want to use) and set it to the Marketing Cloud ID itself. The JavaScript call looks like this:
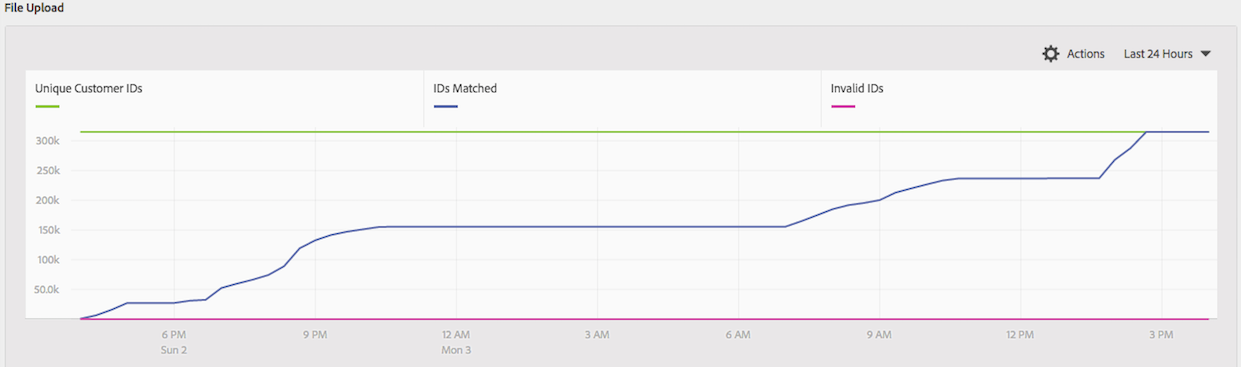
Once you do either of these methods, you should start seeing the number of “IDs Matched” in the Customer Attributes UI go up, which is exactly what you want:
With that done, I can finally see the results of my clustering directly in the Adobe Analytics reporting UI:
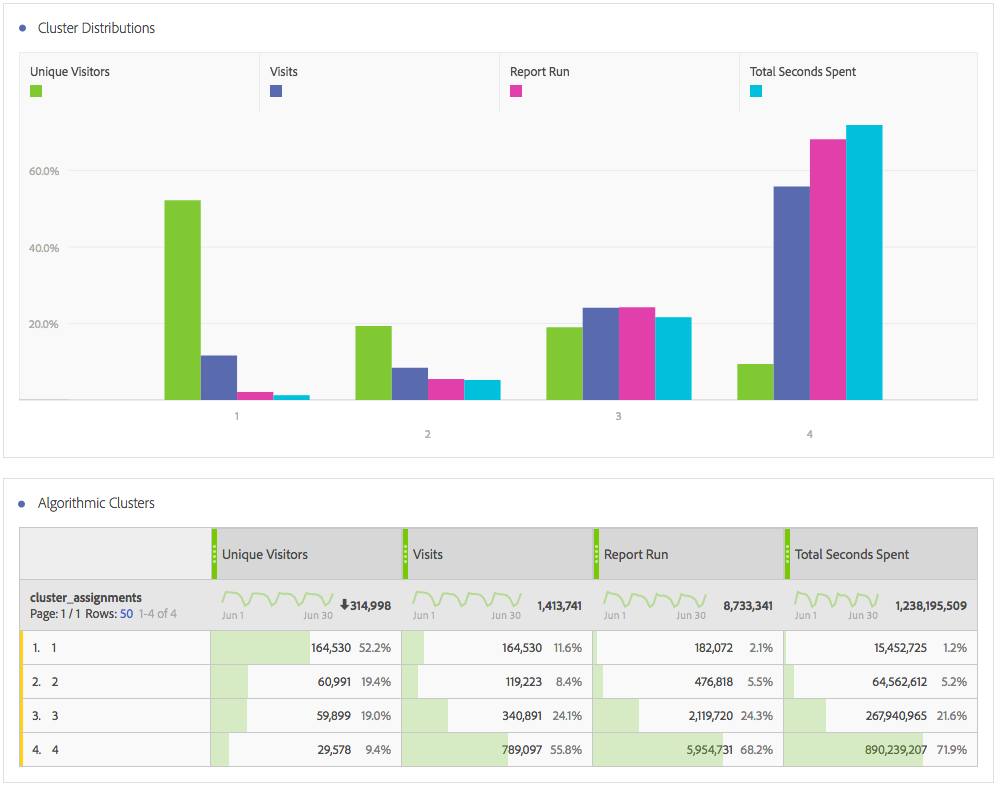
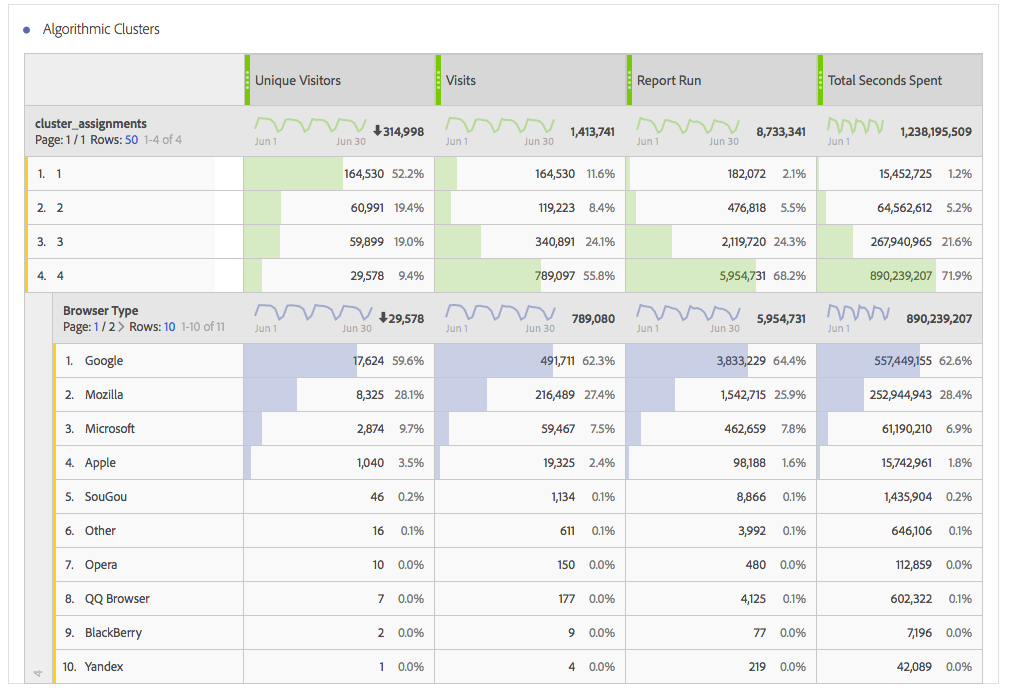
Notice the results exactly match the table I created when I did clustering in my last blog post, but now I can use any Adobe Analytics metric, breakdown, trend, or segment I want in conjunction with my results! For example, I can break down each cluster by browser type (or anything else for that matter):
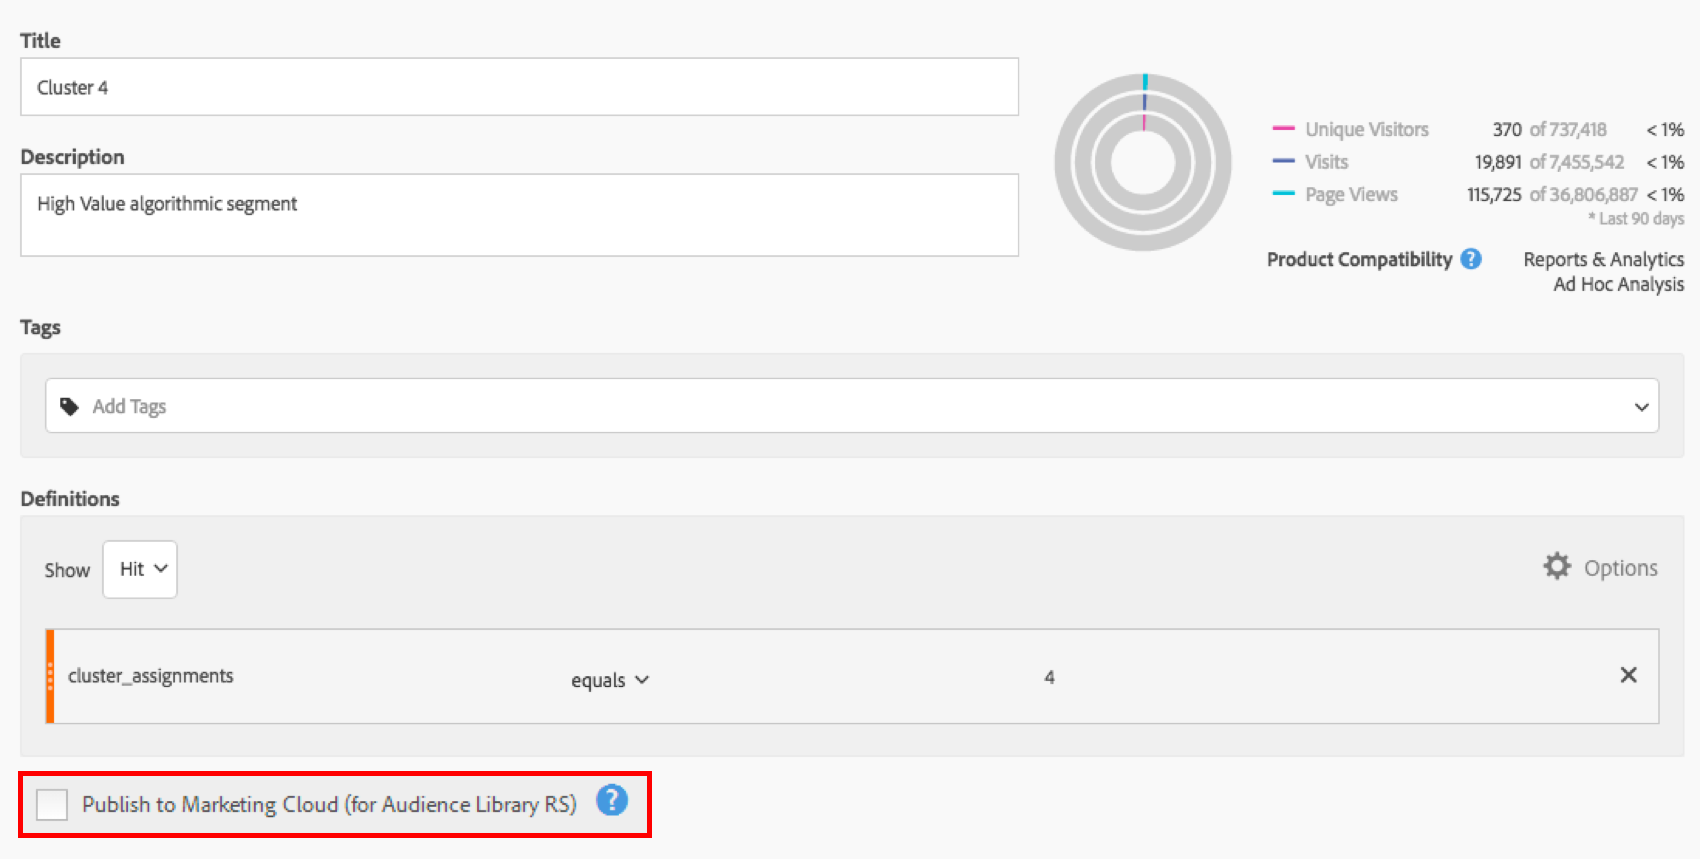
Or, perhaps best of all, I can use the clusters I’ve created as segments and share them with all of the other Marketing Cloud solutions like Target, or Audience Manager. This allows me to advertise directly to my “cluster 4” or run A/B tests against all of my algorithmic clusters. Now that’s far more powerful than viewing the results strictly in a Shiny R dashboard!
Last of all, I’ve set myself up to be able to upload any sort of model against my visitors. If I’d like to send targeted advertising to people that have a 90% probability of purchasing red shoes, I can now do that. The possibilities are endless, and I’m planning on future blog posts to show you how to do just that.
In conclusion, don’t waste any more of your hard work only to have it die in an email or Power Point presentation. Instead, take the results of your model and make it far more useful and actionable by sending the results back into Adobe Analytics where people can use it!
cl = makeCluster(n_cores, type=”FORK”)
hex_visitor_ids = parLapply(cl, local_visitor_rollup$visitor_id, convert_to_hex)
This works fine in LINUX/MAC but not on windows, any suggestions why for the WINDOWS substitute code (below), is not running:
cl = makeCluster(n_cores, type=”PSOCK”)
hex_visitor_ids = parLapply(cl, local_visitor_rollup$visitor_id, convert_to_hex)
Error once hex_visitor_ids is executed in WONDOWS :
Error in checkForRemoteErrors(val) :
3 nodes produced errors; first error: could not find function “formatMpfr”
Maybe get a Mac?? 🙂 j/k
I’m not sure how Windows handles the parallel library. Might be good to check on stackoverflow – let me know if you figure it out!